

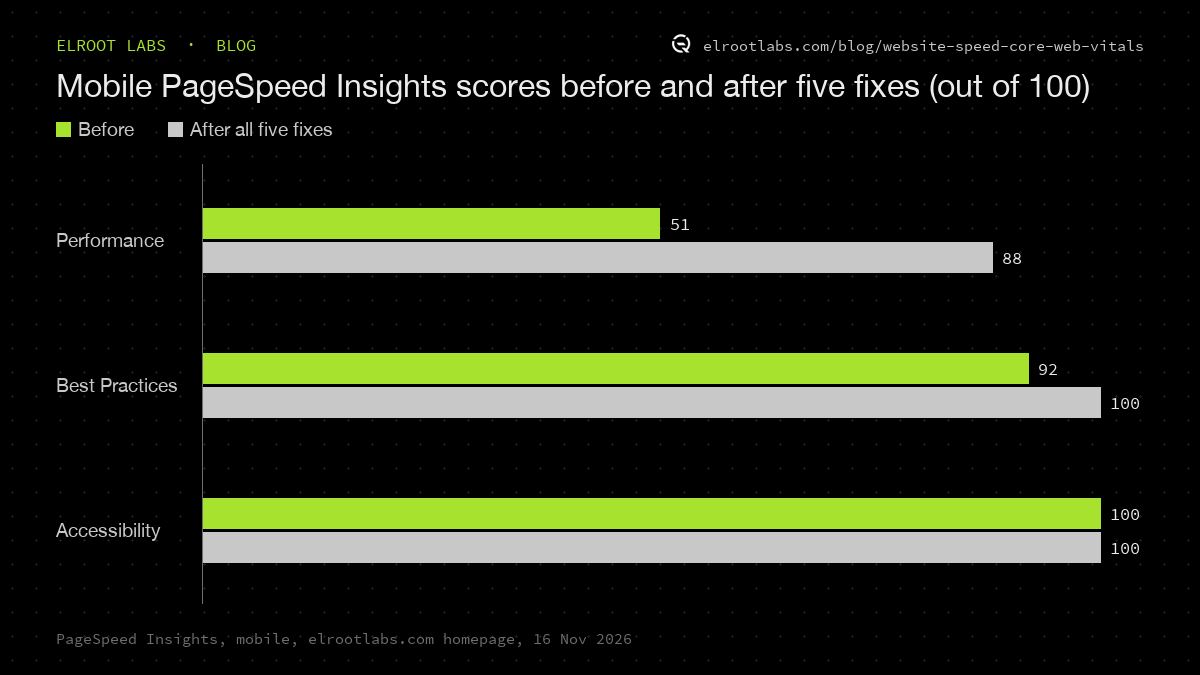
To improve Core Web Vitals on a slow website, measure the page on mobile, fix the single largest item the report names, measure again, and repeat, because each fix uncovers the next problem. That is how our own homepage went from a mobile performance score of 51 to 88 in one day, 16 November 2026, with five changes. The biggest gains did not come from the usual advice. One was a cookie banner that turned out to be the slowest thing on the page, and another was a fading headline that browsers did not count as visible. Below are the five fixes in order, each with its numbers, and how to apply the same order to your own site.
Where we started
We had just moved elrootlabs.com to a new build, a Next.js site running on Cloudflare, and ran Google's PageSpeed Insights on the homepage in its mobile setting. The results:
| Measure | Before | After all five fixes |
|---|---|---|
| Performance score (mobile) | 51 | 88 |
| Largest Contentful Paint | 8.4 s | full marks (1.8 s in a staging run) |
| First Contentful Paint | 3.2 s | 1.5 s |
| Best Practices | 92 | 100 |
| Accessibility | 100 | 100 |
| Cumulative Layout Shift | 0 | 0 |
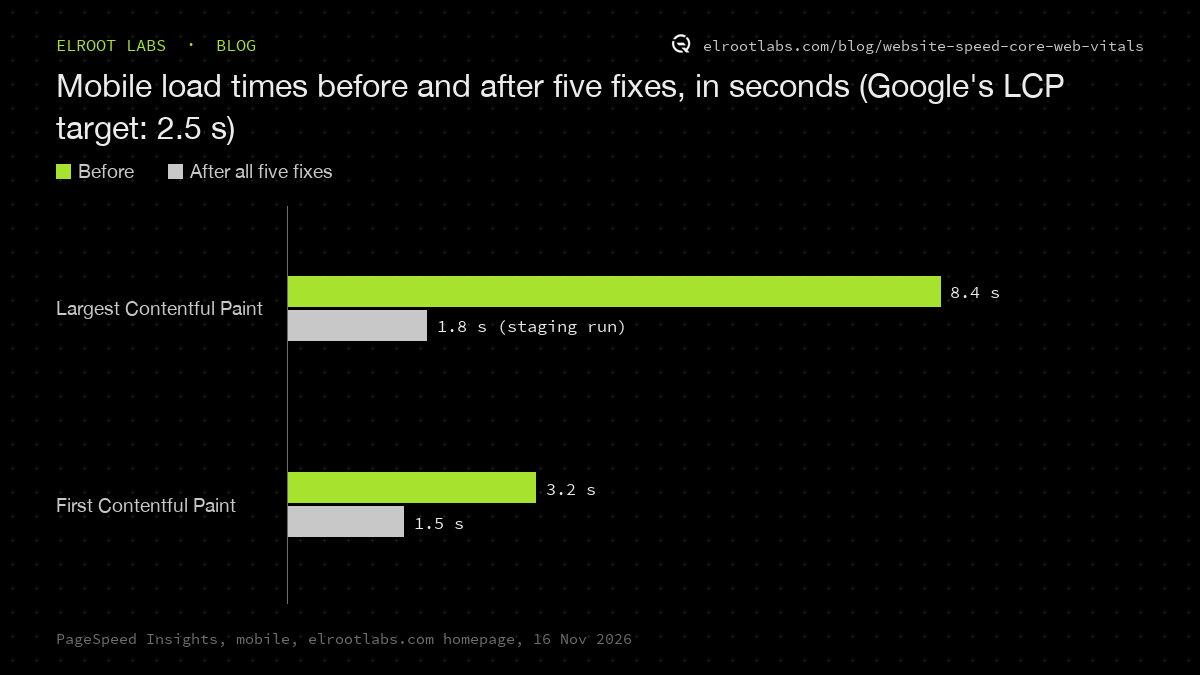
Largest Contentful Paint, LCP, is the measure that matters most here. It is the time until the biggest piece of content on screen has been drawn, and Google's Core Web Vitals guidance asks for it within 2.5 seconds of the page starting to load. At 8.4 seconds, our homepage was more than three times over.
One warning before the fixes: lab scores move between runs. Two back-to-back runs of the same page after our first three fixes gave 64 and 73. We judged every change on more than one run, and you should too, or you will celebrate noise.
Fix 1: the 1 MB logo shown in a 26-pixel slot
PageSpeed listed 1,072 KiB of image savings, and 1,032 KiB of that was one file: the header logo, a 1,254 by 1,254 pixel PNG of about 1 MB, displayed 26 pixels tall. We replaced it with a 104-pixel copy of about 8 KB, enough for sharp display on high-density phone screens. The wordmark image next to it went from about 41 KB to about 8 KB.
A logo or hero photo uploaded at full size is also the easiest problem to check for. Check yours first: open the image in a new tab and look at its dimensions against the space it fills.
Fix 2: the cookie banner was the slowest thing on the page
With the logo fixed, PageSpeed named the page's largest content element. It was the cookie-consent banner text. The banner was built in the browser, so it only appeared after all of the page's JavaScript had loaded and run. To the browser, that late-arriving block of text was the main content, and LCP waited for it.
We moved the banner into the HTML the server sends, and added a tiny script in the page head that hides it before the first paint for visitors who have already made their choice. The banner looks and behaves the same. It now arrives with the rest of the page.
After fixes 1 to 3, the live site scored 64 and 73 on two runs, and LCP fell from 8.4 to 5.6 seconds. If your site has a consent banner, a chat widget or a promotional bar, check whether PageSpeed names it as the LCP element. It is easy to assume that LCP must be the hero image or headline.
Fix 3: a security rule blocked our own analytics
The site's Content-Security-Policy, the header that tells browsers which scripts may run, was blocking Cloudflare's own analytics script. That showed up as an error in the browser console and cost points under Best Practices. Allowing that one script's host took Best Practices from 92 to 100. It did nothing for speed, but it is a reminder to read the console errors in any audit: a blocked script is often a policy written before the tools changed.
Fix 4: 676 KB of code the homepage never used
The new site is built on a large shared component library. The homepage was downloading a file of roughly 400 KB holding menus, dialogs, a command palette and code highlighting that the page never showed, plus a file of roughly 276 KB that still contained analytics code from the original template.
Next.js has a setting for exactly this, optimizePackageImports, which makes the build load only the parts of a package a page actually uses. Turning it on for those packages removed both files from the homepage. Scores on the staging copy rose to between 79 and 82.
Fix 5: the headline faded in, so it did not count
The hero headline faded in from fully transparent. That looked fine, and it cost us LCP, because Chromium-based browsers exclude elements with an opacity of 0 when they decide what has been painted, as web.dev's LCP article explains. The headline only counted once the fade finished.
We changed the starting opacity from 0 to 0.01. Nobody can see the difference, and the browser now counts the headline as painted the moment it appears. LCP went to full marks, and the live score settled at 88 on mobile and 99 on desktop. We kept the animation because the owner wanted the look, which is a fair constraint: speed work should keep what the business chose, not strip the page bare.
Why we stopped at 88
What remains is JavaScript run time, the time the phone's processor spends executing code before the page responds. Going further would mean rewriting parts of the shared template, which costs more than the last few points are worth for a site like ours. The other pages, measured once each after the fixes, scored 89 for services, 98 for contact, 88 for the blog, 94 for our work page and 70 for about, which is next on the list.
What to check on your own slow site, in this order
- Run PageSpeed Insights on mobile, twice, and write down both scores.
- Open the list of image savings. Fix the largest file first, usually a logo or hero photo uploaded at full size.
- Find which element PageSpeed names as the LCP element. If it is a banner, popup or widget built in the browser, render it with the page instead.
- Read the browser console for blocked scripts and errors.
- Look for large JavaScript files the page does not use, often left over from a theme, template or plugin.
- Check anything that fades or slides in above the fold. A starting opacity of 0 can delay LCP.
- Measure again after each change. The next problem only shows once the current one is gone.
The first two steps are also the cheapest to fix. If your site is slow on phones and you would like it measured and fixed the same way, tell us about it.